Good Life Advisors – Talking Points – Week 18
Don’t Fight The Fed
Interest rates dominated the markets this week as the May FOMC meeting ended with a 50 bp rate hike, as expected, while the Fed also announced the start of a June balance sheet drawdown. The highlight of the meeting was Chair Powell essentially ruling out 75 bp hikes in the coming meetings, saying that 50 bp hikes will be on the table for the next several meetings. However, markets didn’t seem to believe Powell on 75 bp hikes, with the market pricing in 90% chance of a 75 bp hikes in June, according to CME’s FedWatch. Bond yields have climbed dramatically, take a look at the year-to-date increase in yields:
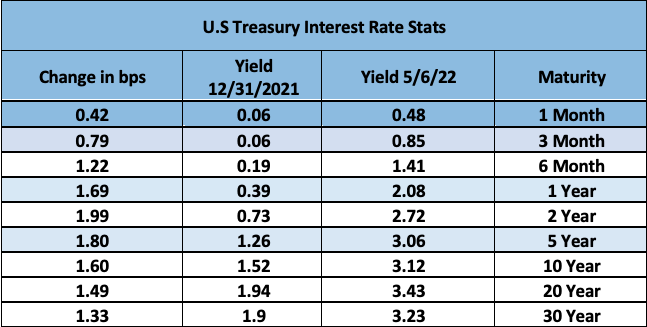
The S&P 500 started the week with three-straight gains, rallying 3% after Wednesday’s FOMC meeting. However, it gave back all of those gains the following day. There wasn’t one catalyst to the selloff, but markets faced particular headwinds from a big and rapid backup in yields. 30Y Treasury yields were up 27 bp on the week, and 10Y yields up 24 bp, while all durations from 5Y and beyond finished solidly above 3% and at the highest levels since late 2018, JPMorgan analysts noted there have only been six instances in the past decade where the 30Y yield jumped more than they did on Thursday. Dollar strength also played into fears of tightening financial conditions.
The selloff has hit some groups particularly hard, including high-valuation groups, liquidity/momentum-linked names, meme stocks, crypto, and pandemic winners. Tech valuations have retreated from a 50% premium in November to 31% today, nearing the long-term 25% premium. Some strategists have also noted tech/media/telecom stocks could have more room to fall as earnings across the group have fallen as a share of the broader S&P 500. There has also been a focus on pain trade across finds, including FT noting this week Tiger Global’s flagship long-only fund fell more than 40% so far this year amid big selloff across fund’s tech holdings.
This week’s April nonfarm payrolls report showed headline payrolls growth of 428k, ahead of consensus for 396k through prior two months revised down 39k lower. Economists noted the report was better than feared after weaker ADP and ISM reports, though there was some focus on the dip in the participation rate. However, weaker average hourly earnings also may have added another point to the peak-inflation thesis.
On the crypto front, bitcoin hit an all-time high of $67,566 in November, it’s currently trading at $34,601 (5/8), that’s a 48% drawdown so far.

Fixed Income
FOMC Minutes Credit, Liquidity and Balance Sheet Federal Reserve Dot Plots
US Corporate Debt Tops 7 Trillion. Treasury.gov yields FOMC Policy Normalization Statement Longer Run Goals August 2020
Foreign Exchange Market
Energy Complex
The Baker Hughes rig count gained 7 this week. There are 705 oil and gas rigs operating in the US – Up 257 over last year.
Metals Complex
Employment Picture
April Jobs Report – BLS Summary – Released 5/6/2022 – The US Economy added 428k nonfarm jobs in April and the Unemployment rate stayed unchanged at 3.6%. Average hourly earning increased 10 to $31.85. Hiring highlights include +78k Leisure and Hospitality, +59k Education and Health Services, and +55k Manufacturing.
- Average hourly earnings increased 10 cents to $31.85.
- U3 unemployment rate remained unchanged at 3.6%. U6 unemployment rate slightly increased from 6.9% to 7.0%.
- The labor force participation rate was little changed at 62.2%.
- Average work week was unchanged at 34.6 hours.
Weekly Unemployment Claims – Released 5/5/2022 – The week ending April 30th observed an increase of 19k in initial claims increasing to 200k. The four-week moving average of initial jobless claims increased 8k to 188k.
Job Openings & Labor Turnover Survey – JOLTS – Released 5/3/2022 – The US Bureau of Labor Statistics reported the number and rate of job openings increased to 11.5 million on the last business day of March. Over the month, hires were little changes at 6.7 million and separations increased to 6.3 million. Within separations, quits increased to 4.5 million. The layoffs and discharges rates were little changes at 1.4 million.
Employment Cost Index – Released 4/29/2022 – Compensation casts for civilian workers increased 1.4% for the 3-month period ending in March 2022 saw compensation costs increase by 4.5%. The 12-month period ending March 2021 increased 2.6%. Wages and salaries increased 4.7% over the year and increased 2.7% for the 12-month period ending in March 2021. Benefit costs increased 4.1% over the year and increased 2.5% for the 12-month period ending in March 2021. This report is published quarterly.
This Week’s Economic Data
Links take you to the data source
Consumer Credit – Released 5/6/2022 – Consumer credit increased at a seasonally adjusted annual rate of 9.7 % in the first quarter of 2022. Revolving credit increased at an annual rate of 6.1%.
U.S. Trade Balance – Released 5/4/2022 – According to the US Census Bureau of Economic Analysis, the goods and services deficit increased in March by $20 billion to $109.8 billion. March exports were $241.7 billion, $12.9 billion more than February exports. march imports were $351.5 billion, $32.9 million more than February imports. Year to date, the goods and services deficit increased $84.8 billion, or 41.5%, from the same period in 2021. Exports increased $104.5 billion or 17.7%. Imports increased $189.3 billion or 23.8%.
PMI Non-Manufacturing Index – Released 5/4/2022 – Economic activity in the non-manufacturing sector grew in April for the 23rd consecutive month. ISM Non-Manufacturing registered 57.1%, which is 1.2 percentage points below the March reading of 58.3%.
PMI Manufacturing Index – Released 5/2/2022 – April PMI decreased 1.7% to 55.4% down from March’s reading of 57.1%. The New Orders Index was 53.5% down 0.3% from March’s reading of 53.8%. The Production Index registered 53..6%, down 0.9%.
U.S. Construction Spending – Released 5/2/2022 – Constructions pending increased 0.1% in March measuring at a seasonally adjusted annual rate of $1,730.5 billion. The March figure is 11.7% above the March 2021 estimate. Private construction spending was 0.2% above the revised February estimate at $1,376.9 billion. Public construction spending was 0.2% below the revised February estimate at $350.8 billion.
Recent Economic Data
Links take you to the data source
US Light Vehicle Sales – Released 4/29/2022 – US light vehicle sales were at a Seasonally Adjusted Rate (SAAR) of 13.365 million units in March.
Chicago PMI – Released 4/29/2022 – Chicago PMI decreased by 6.5 points in April to 56.4. All five of the main five indicators increased.
Personal Income – Released 4/29/2022 – Personal income increased $107.2 billion or 0.5% in March according to estimates released today by the Bureau of Economic Analysis. Disposable personal income (DPI) increased $89.7 billion or 0.5% and Personal Consumption Expenditures (PCE) increased $185 billion or 1.1%.
Advance Estimate of 1st Quarter 2022 GDP – Released 4/28/2022 – Real Gross Domestic Product (GDP) decreased at an annual rate of 1.4% in the first quarter of 2022, according to the advance estimate released by the Bureau of Economic Analysis. GDP increased 6.9% in the fourth quarter of 2021. The GDP advance estimate is based on data that are incomplete or subject to further revision. The decrease in real GDP reflected the decrease in private inventory investment, exports, federal government spending, and state and local government spending, while imports, which are a subtraction in the calculation of GDP, increased. Personal Consumption Expenditures (PCE), nonresidential fixed investment, and residential fixed investment increased.
Employment Cost Index – Released 4/29/2022 – Compensation costs for civilian workers increased 1.4% for the 3-month period ending in March 2022. The 12-month period ending in March 2022 saw compensation costs increase by 4.5%. The 12-month period ending in March 2021 increased 2.6%. Wages and salaries increased 4.7% over the year and increased 2.7% for the 12-month period ending in March 2021. Benefit costs increased 4.1% over the year and increased 2.5% for the 12-month period ending in March 2021. This report is published quarterly.
Consumer Confidence – Released 4/26/2022 – The Consumer Confidence Index saw a slight decline in April following an increase in March. The Index now stands at 107.3, down from 107.6 in March.
Durable Goods – Released 4/26/2022 – Now orders for manufactured durable goods in March increased $2.3 billion or 0.8% to $275 billion. Computer and electronic products lead the increase rising $0.7 billion or 2.6% to $26.3 billion.
New Residential Sales – Released 4/26/2022 – Sales of new single-family homes decreased 8.6% to 763k, seasonally adjusted, in March. The median sales price of now holes sold in February was $436,700 with an average sales price of $523,900. At the end of March, the seasonally adjusted estimate of new homes for sale was 407k. This represents a supply of 6.4 months at the current sales rate.
Existing Home Sales – Released 4/20/2022 – Existing home sales decreased in March following a decrease in February. Sales declined 2.7% to a seasonally adjusted rate of 5.77 million in March. Sales decreased 4.5% year-over-year. Housing inventory sits at 950k units. Up 11.8% from February’s inventory. Down 9.5% over last year. Unsold inventory sits at a 1.7-month supply. The median existing home price for all housing types was $375,300, which is up 15% from March 2021. This marks 121 consecutive months of year-over-year increased, the longest-running streak in record.
Housing Starts – Released 4/19/2022 – Now home starts in March were at a seasonally adjusted annual rate of 1.793 million, up 0.3% above February, and 3.9% above last march’s rate. Building permits were at a seasonally adjusted annual rate of 1.865 million, up 0.4% compared to February, but up 6.7% over last year.
Industrial Production and Capacity Utilization – Released 4/15/2022 – In March, Industrial production increased 0.9%. Manufacturing increased 0.9%. Utilities output increased 0.4. Mining output increased 1.7%. Total industrial production rate of 1.865 million, up 0.4% compared to February, but up 6.7% over last year.
Retail Sales – Released 4/14/2022 – US retail sales for March increased 0.5% to $665.7 billion and retail sales are 6.9% above March 2021. US retail sales for the January 2022 through March 2022 period were up 12.9% from the same period a year ago.
Producer Price Index – Released 4/13/2022 – The Producer Price Index for final demand increased 1.4% in March. PPI less food and energy increased 1.1%. The change in PPI for final demand has increased 11.2% year/y.
Consumer Price Index – Released 4/12/2022 – Consumer prices rose 1.2% m/m in March following a 0.8% gain in February. Consumer prices are up 8.5% for the 12-month period ending in March. Core consumer prices increased 0.3% m/m in March following a 0.5% gain in February.
Next week we get data on CPI and PPI.
Data Sources:
Bureau of Economic Analysis (BEA)
Congressional Budget Office (CBO)
U.S. Bureau of Labor Statistics (BLS)
Federal Reserve Economic Data (FRED Charts)
CME Fed Watch
U.S. Treasury – Yields
U.S. Census Bureau
Institute for Supply Management (ISM)
Weekly DOL Employment Data
BLS Monthly Jobs Report
JOLTS
US Energy Admin (EIA)
BLS Consumer Price Index CPI
BLS Producer Price Index PPI
Atlanta Fed GDPNOW
NY Fed Nowcast GDP
US Census Bureau Housing Starts
Consumer Credit
USCB Retail Sales
Construction Spending
Federal Reserve Dot Plots
NY Empire Index
Philadelphia Federal Reserve
P/E Ratio Data -Yardeni Research
Technical Analysis Info:
StockCharts.com – Financial Charts
Exponential vs Simple moving average
Other Links:
1973 Arab Oil Embargo
Hunt Brothers Silver
Long-Term Capital bailout
Good Life Advisors – Talking Points – Week 18
Don’t Fight The Fed
Interest rates dominated the markets this week as the May FOMC meeting ended with a 50 bp rate hike, as expected, while the Fed also announced the start of a June balance sheet drawdown. The highlight of the meeting was Chair Powell essentially ruling out 75 bp hikes in the coming meetings, saying that 50 bp hikes will be on the table for the next several meetings. However, markets didn’t seem to believe Powell on 75 bp hikes, with the market pricing in 90% chance of a 75 bp hikes in June, according to CME’s FedWatch. Bond yields have climbed dramatically, take a look at the year-to-date increase in yields:
The S&P 500 started the week with three-straight gains, rallying 3% after Wednesday’s FOMC meeting. However, it gave back all of those gains the following day. There wasn’t one catalyst to the selloff, but markets faced particular headwinds from a big and rapid backup in yields. 30Y Treasury yields were up 27 bp on the week, and 10Y yields up 24 bp, while all durations from 5Y and beyond finished solidly above 3% and at the highest levels since late 2018, JPMorgan analysts noted there have only been six instances in the past decade where the 30Y yield jumped more than they did on Thursday. Dollar strength also played into fears of tightening financial conditions.
The selloff has hit some groups particularly hard, including high-valuation groups, liquidity/momentum-linked names, meme stocks, crypto, and pandemic winners. Tech valuations have retreated from a 50% premium in November to 31% today, nearing the long-term 25% premium. Some strategists have also noted tech/media/telecom stocks could have more room to fall as earnings across the group have fallen as a share of the broader S&P 500. There has also been a focus on pain trade across finds, including FT noting this week Tiger Global’s flagship long-only fund fell more than 40% so far this year amid big selloff across fund’s tech holdings.
This week’s April nonfarm payrolls report showed headline payrolls growth of 428k, ahead of consensus for 396k through prior two months revised down 39k lower. Economists noted the report was better than feared after weaker ADP and ISM reports, though there was some focus on the dip in the participation rate. However, weaker average hourly earnings also may have added another point to the peak-inflation thesis.
On the crypto front, bitcoin hit an all-time high of $67,566 in November, it’s currently trading at $34,601 (5/8), that’s a 48% drawdown so far.
Table of Contents
Fixed Income
FOMC Minutes Credit, Liquidity and Balance Sheet Federal Reserve Dot Plots
US Corporate Debt Tops 7 Trillion. Treasury.gov yields FOMC Policy Normalization Statement Longer Run Goals August 2020
Foreign Exchange Market
Energy Complex
The Baker Hughes rig count gained 7 this week. There are 705 oil and gas rigs operating in the US – Up 257 over last year.
Metals Complex
Employment Picture
April Jobs Report – BLS Summary – Released 5/6/2022 – The US Economy added 428k nonfarm jobs in April and the Unemployment rate stayed unchanged at 3.6%. Average hourly earning increased 10 to $31.85. Hiring highlights include +78k Leisure and Hospitality, +59k Education and Health Services, and +55k Manufacturing.
Weekly Unemployment Claims – Released 5/5/2022 – The week ending April 30th observed an increase of 19k in initial claims increasing to 200k. The four-week moving average of initial jobless claims increased 8k to 188k.
Job Openings & Labor Turnover Survey – JOLTS – Released 5/3/2022 – The US Bureau of Labor Statistics reported the number and rate of job openings increased to 11.5 million on the last business day of March. Over the month, hires were little changes at 6.7 million and separations increased to 6.3 million. Within separations, quits increased to 4.5 million. The layoffs and discharges rates were little changes at 1.4 million.
Employment Cost Index – Released 4/29/2022 – Compensation casts for civilian workers increased 1.4% for the 3-month period ending in March 2022 saw compensation costs increase by 4.5%. The 12-month period ending March 2021 increased 2.6%. Wages and salaries increased 4.7% over the year and increased 2.7% for the 12-month period ending in March 2021. Benefit costs increased 4.1% over the year and increased 2.5% for the 12-month period ending in March 2021. This report is published quarterly.
This Week’s Economic Data
Links take you to the data source
Consumer Credit – Released 5/6/2022 – Consumer credit increased at a seasonally adjusted annual rate of 9.7 % in the first quarter of 2022. Revolving credit increased at an annual rate of 6.1%.
U.S. Trade Balance – Released 5/4/2022 – According to the US Census Bureau of Economic Analysis, the goods and services deficit increased in March by $20 billion to $109.8 billion. March exports were $241.7 billion, $12.9 billion more than February exports. march imports were $351.5 billion, $32.9 million more than February imports. Year to date, the goods and services deficit increased $84.8 billion, or 41.5%, from the same period in 2021. Exports increased $104.5 billion or 17.7%. Imports increased $189.3 billion or 23.8%.
PMI Non-Manufacturing Index – Released 5/4/2022 – Economic activity in the non-manufacturing sector grew in April for the 23rd consecutive month. ISM Non-Manufacturing registered 57.1%, which is 1.2 percentage points below the March reading of 58.3%.
PMI Manufacturing Index – Released 5/2/2022 – April PMI decreased 1.7% to 55.4% down from March’s reading of 57.1%. The New Orders Index was 53.5% down 0.3% from March’s reading of 53.8%. The Production Index registered 53..6%, down 0.9%.
U.S. Construction Spending – Released 5/2/2022 – Constructions pending increased 0.1% in March measuring at a seasonally adjusted annual rate of $1,730.5 billion. The March figure is 11.7% above the March 2021 estimate. Private construction spending was 0.2% above the revised February estimate at $1,376.9 billion. Public construction spending was 0.2% below the revised February estimate at $350.8 billion.
Recent Economic Data
Links take you to the data source
US Light Vehicle Sales – Released 4/29/2022 – US light vehicle sales were at a Seasonally Adjusted Rate (SAAR) of 13.365 million units in March.
Chicago PMI – Released 4/29/2022 – Chicago PMI decreased by 6.5 points in April to 56.4. All five of the main five indicators increased.
Personal Income – Released 4/29/2022 – Personal income increased $107.2 billion or 0.5% in March according to estimates released today by the Bureau of Economic Analysis. Disposable personal income (DPI) increased $89.7 billion or 0.5% and Personal Consumption Expenditures (PCE) increased $185 billion or 1.1%.
Advance Estimate of 1st Quarter 2022 GDP – Released 4/28/2022 – Real Gross Domestic Product (GDP) decreased at an annual rate of 1.4% in the first quarter of 2022, according to the advance estimate released by the Bureau of Economic Analysis. GDP increased 6.9% in the fourth quarter of 2021. The GDP advance estimate is based on data that are incomplete or subject to further revision. The decrease in real GDP reflected the decrease in private inventory investment, exports, federal government spending, and state and local government spending, while imports, which are a subtraction in the calculation of GDP, increased. Personal Consumption Expenditures (PCE), nonresidential fixed investment, and residential fixed investment increased.
Employment Cost Index – Released 4/29/2022 – Compensation costs for civilian workers increased 1.4% for the 3-month period ending in March 2022. The 12-month period ending in March 2022 saw compensation costs increase by 4.5%. The 12-month period ending in March 2021 increased 2.6%. Wages and salaries increased 4.7% over the year and increased 2.7% for the 12-month period ending in March 2021. Benefit costs increased 4.1% over the year and increased 2.5% for the 12-month period ending in March 2021. This report is published quarterly.
Consumer Confidence – Released 4/26/2022 – The Consumer Confidence Index saw a slight decline in April following an increase in March. The Index now stands at 107.3, down from 107.6 in March.
Durable Goods – Released 4/26/2022 – Now orders for manufactured durable goods in March increased $2.3 billion or 0.8% to $275 billion. Computer and electronic products lead the increase rising $0.7 billion or 2.6% to $26.3 billion.
New Residential Sales – Released 4/26/2022 – Sales of new single-family homes decreased 8.6% to 763k, seasonally adjusted, in March. The median sales price of now holes sold in February was $436,700 with an average sales price of $523,900. At the end of March, the seasonally adjusted estimate of new homes for sale was 407k. This represents a supply of 6.4 months at the current sales rate.
Existing Home Sales – Released 4/20/2022 – Existing home sales decreased in March following a decrease in February. Sales declined 2.7% to a seasonally adjusted rate of 5.77 million in March. Sales decreased 4.5% year-over-year. Housing inventory sits at 950k units. Up 11.8% from February’s inventory. Down 9.5% over last year. Unsold inventory sits at a 1.7-month supply. The median existing home price for all housing types was $375,300, which is up 15% from March 2021. This marks 121 consecutive months of year-over-year increased, the longest-running streak in record.
Housing Starts – Released 4/19/2022 – Now home starts in March were at a seasonally adjusted annual rate of 1.793 million, up 0.3% above February, and 3.9% above last march’s rate. Building permits were at a seasonally adjusted annual rate of 1.865 million, up 0.4% compared to February, but up 6.7% over last year.
Industrial Production and Capacity Utilization – Released 4/15/2022 – In March, Industrial production increased 0.9%. Manufacturing increased 0.9%. Utilities output increased 0.4. Mining output increased 1.7%. Total industrial production rate of 1.865 million, up 0.4% compared to February, but up 6.7% over last year.
Retail Sales – Released 4/14/2022 – US retail sales for March increased 0.5% to $665.7 billion and retail sales are 6.9% above March 2021. US retail sales for the January 2022 through March 2022 period were up 12.9% from the same period a year ago.
Producer Price Index – Released 4/13/2022 – The Producer Price Index for final demand increased 1.4% in March. PPI less food and energy increased 1.1%. The change in PPI for final demand has increased 11.2% year/y.
Consumer Price Index – Released 4/12/2022 – Consumer prices rose 1.2% m/m in March following a 0.8% gain in February. Consumer prices are up 8.5% for the 12-month period ending in March. Core consumer prices increased 0.3% m/m in March following a 0.5% gain in February.
Next week we get data on CPI and PPI.
Data Sources:
Bureau of Economic Analysis (BEA)
Congressional Budget Office (CBO)
U.S. Bureau of Labor Statistics (BLS)
Federal Reserve Economic Data (FRED Charts)
CME Fed Watch
U.S. Treasury – Yields
U.S. Census Bureau
Institute for Supply Management (ISM)
Weekly DOL Employment Data
BLS Monthly Jobs Report
JOLTS
US Energy Admin (EIA)
BLS Consumer Price Index CPI
BLS Producer Price Index PPI
Atlanta Fed GDPNOW
NY Fed Nowcast GDP
US Census Bureau Housing Starts
Consumer Credit
USCB Retail Sales
Construction Spending
Federal Reserve Dot Plots
NY Empire Index
Philadelphia Federal Reserve
P/E Ratio Data -Yardeni Research
Technical Analysis Info:
StockCharts.com – Financial Charts
Exponential vs Simple moving average
Other Links:
1973 Arab Oil Embargo
Hunt Brothers Silver
Long-Term Capital bailout
Categories:
Tags: