Good Life Advisors – Talking Points – Week 31
Fitch Pitches Markets a Curveball…
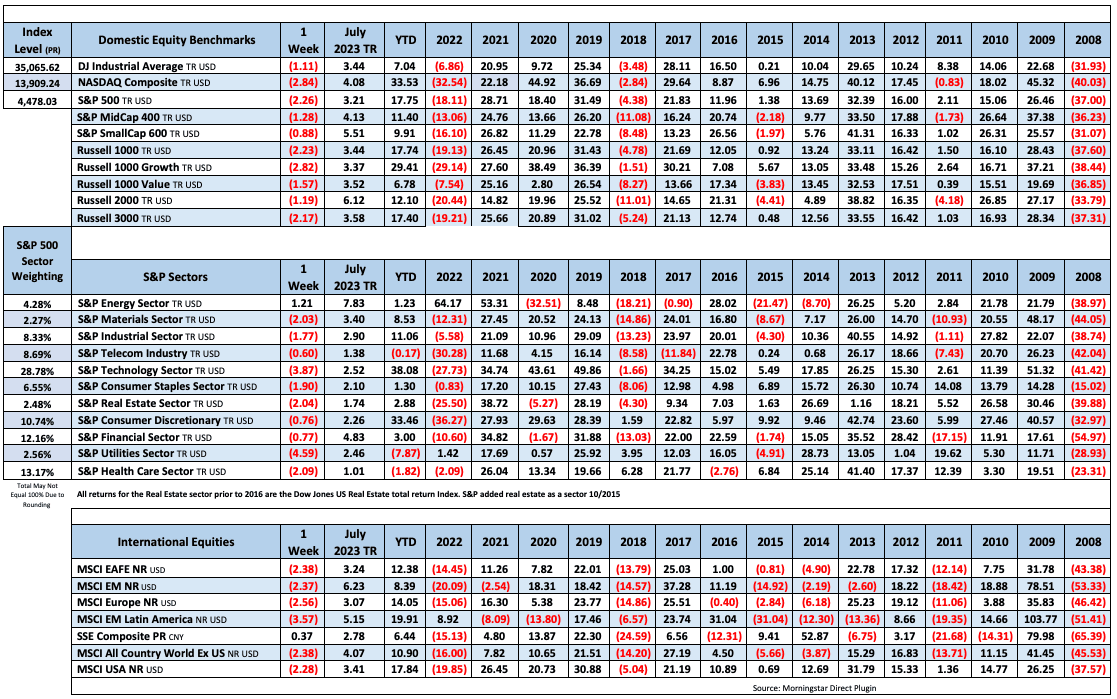
US equities were lower this week as the S&P 500 was down for the first week in four, while the tech-heavy Nasdaq trailed the broader S&P. Big tech was mostly lower, while semis, tech hardware, medical supplies, airlines, road and rail, parcels and logistics, casinos, cruise lines, hotels, autos, and telecom were some of the other notable underperformers. Some outperformers included networking/IT equipment, machinery energy, paper and packaging, multiline insurance, cable/satellite, apparel, home furnishings, medical distributors, and biotech. Treasuries were mixed with a big curve steepening move. The 2Y/10Y spread narrowed to around -50 bp from -87 bp last week, while the 10Y yield rose earlier this week above 4.10% for the first time in 10 months. The dollar index was down 0.8%, weaker on the major crosses. Gold was up 0.8% for the week. Bitcoin futures were little changed this week. WTI crude was up 2.8% for a sixth-straight weekly gain, all of which were at least 2%.
S&P 500 Sector Performance:
-
- Outperformers: Energy +1.15%, Consumer Disc. (0.23%), Financials (0.83%), Industrials (1.79%), Consumer Spls. (1.90%), Materials (2.03%), Healthcare (2.09%), Real Estate (2.20%)
- Underperformers: Utilities (4.66%), Tech (4.14%), Communication Services (2.85%)
Stocks finished the week lower as the S&P 500 broke a three-week streak of gains. The week’s downside was tabbed to a few factors, including the Fitch US debt downgrade, risk around a higher-for-longer Fed, overbought conditions, stretched sentiment and positioning, disinflation as an earnings headwind, fading normalization tailwinds, some concerns around consumer/discretionary spend, and rising oil and gasoline prices. This week’s big tech earnings (Amazon and Apple) also offered some mixed takeaways, with Apple’s weaker hardware trends in focus. However, recent bullish narratives that remain intact include more soft landing support, peak-Fed and a potential 1H-24 pivot to cuts, more disinflationary traction, positive macro surprise momentum, strong household balance sheets.
This week also saw a big yield curve steepening move with the 10Y yield up over 15 bp, pushing beyond 4.10% for the first time since November, though the short end of the curve rallied amid the latest round of positive macro surprise momentum. The 30Y was also up nearly 20 bp w/w, some of which was tabbed to this week’s Treasury refunding announcement, which will increase 2Y, 5Y, and 10Y auction sizes. Treasury also said that further increases will be likely in future quarters. This week’s Fitch downgrade of US debt also played into the backup on the long end of the curve, signaling risk of growing deficits and rising interest costs further out into the future. Other factors also played into the week’s backup in yields included positioning and technical factors, the Fed’s commitment to QT, and the BoJ’s YCC policy tweak.
However, this week saw more support for the soft landing and peak-Fed narratives. Friday’s July payrolls report signaled more slowing in the pace of job growth. The July print missed consensus for a second-straight month with the lowest print since the Dec-20 contraction, while the prior two months were revised lower. Average hourly wages came in hotter, though that was offset by lower hours worked. Bank of America and JPMorgan economists also revised their outlook for no recession, citing factors including strong economy activity over recent quarters, a low unemployment rate combined with softening wage and price pressures, and stabilization in cyclical sectors. The market median year-end fed funds rate of 4.39% was little changed this week, though the market is now pricing in a rate cut in Mar-24, up from May-24 last week.
With 84% of S&P 500 companies having now reporting Q2 earnings, 79% of those companies have reported EPS above estimates, better than the five-year average of 77%. The actual y/y earnings decline also improved to -5.2% from -7.4% last week, though still on pace for the largest annualized earnings decline since Q2-20 (-5.7%).
Fixed Income

Yield Curve
May FOMC Statement March Fed Minutes Balance Sheet Reduction Plan Credit, Liquidity and Balance Sheet Federal Reserve Dot Plots
Treasury.gov yields FOMC Policy Normalization Statement Longer- Run Goals Jan 2022
Foreign Exchange Market
Energy Complex
The Baker Hughes rig count was down 5 this week. There are 659 oil and gas rigs operating in the US – Down 105 from last year.
Metals Complex
Employment Picture
July Jobs Report – BLS Summary – Released 8/4/2023 – The US Economy added 187k nonfarm jobs in July and the Unemployment rate was little changed at 3.5%. Average hourly earnings increased 14 cents to $33.74. Hiring highlights include +100k Education and Health Services.
- Average hourly earnings increased 14 cents/0.4% to $33.74.
- U3 unemployment rate was little changed at 3.5%. U6 unemployment rate decreased 0.2% to 6.7%.
- The labor force participation rate was unchanged at 62.6%.
- Average work week decreased 0.1 hours to 34.3 hours.
Weekly Unemployment Claims – Released Thursday 8/3/2023 – In the week ending July 29, the advance figure for seasonally adjusted initial claims was 227,000 increasing 6,000 from the previous week’s revised level. The 4-week moving average was 228,250 a decrease of 5,500 from the previous week’s revised average.
Job Openings & Labor Turnover Survey JOLTS – Released 8/1/2023 – The number of job openings decreased to 9.6 million on the last business day of June, the U.S. Bureau of Labor Statistics reported. Over the month the number of hires and total separations decreased to 5.9 million and 5.6 million, respectively. Within separations, quits (3.8 million) increased and discharges (1.5 million) changed little.
Employment Cost Index – Released 7/28/2023 – Compensation costs for civilian workers increased 1.0% for the 3-month period ending in June 2023. The 12-month period ending in June 2023 saw compensation costs increase by 4.5. The 12-month period ending June 2022 increased 5.1%. Wages and salaries increased 4.6 percent over the 12-month June 2023 and increased 5.3 percent for the 12-month period ending in June 2022. Benefit costs increased 4.2 percent over the 12-month period ending June 2023 and increased 4.8 percent for the 12-month period ending in June 2022. This report is published quarterly.
This Week’s Economic Data
Links take you to the data source
PMI Non-Manufacturing Index – Released 8/3/2023 – Economic activity in the services sector expanded in July for the seventh consecutive month as the Services PMI® registered 52.7 percent, 1.2 percentage point lower than June’s reading of 53.9 percent.
U.S. Construction Spending – Released 8/1/2023 – Construction spending during June 2023 was estimated at a seasonally adjusted annual rate of $1,938.4 billion, 0.5 percent above the revised May estimate of $1,929.6 billion. The June figure is 3.5 percent above the June 2022 estimate of $1,873.2 billion.
PMI Manufacturing Index – Released 8/1/2023 – The July Manufacturing PMI registered 46.4 percent, 0.4 percentage points higher than the 46.0 percent recorded in June. Regarding the overall economy, this figure indicates an eighth month of contraction after a 30-month period of expansion. The New Orders Index remained in contraction territory at 47.3 percent, 1.7 percentage points higher than the figure of 45.6 percent recorded in June. The Production Index reading of 48.3 percent is a 1.6-percentage point increase compared to June’s figure of 46.7 percent.
Chicago PMI – Released 7/31/2023 – Chicago PMI remained in contraction territory in July increasing to 42.8 points up from 41.5 points in June. This marks eleven months in contractionary territory.
Recent Economic Data
Links take you to the data source
US Light Vehicle Sales – Released 7/28/2023 – U.S. light vehicle sales were at a seasonally adjusted annual rate (SAAR) of 15.657 million units in June.
Personal Income – Released 7/28/2023 – Personal income increased $69.5 billion (0.3 percent at a monthly rate) in June. Disposable personal income (DPI) increased $67.5 billion (0.3 percent). Personal consumption expenditures (PCE) increased $100.4 billion (0.5 percent).
Advance Estimate of 2nd Quarter 2023 GDP – Released 7/27/2023 – Real gross domestic product (GDP) increased at an annual rate of 2.4 percent in the second quarter of 2023, according to the “advance” estimate released by the Bureau of Economic Analysis. In the first quarter, real GDP increased 2.0 percent. The GDP estimate released today is based on source data that are incomplete or subject to further revision. The increase in real GDP reflected increases in consumer spending, nonresidential fixed investment, state and local government spending, private inventory investment, and federal government spending that were partly offset by decreases in exports and residential fixed investment. Imports, which are a subtraction in the calculation of GDP, decreased.
Durable Goods – Released 7/27/2023 – New orders for manufactured durable goods in June, up four consecutive months, increased $13.6 billion or 4.7 percent to $302.5 billion, the U.S. Census Bureau announced today. This followed a 2.0 percent May increase. Excluding transportation, new orders increased 0.6 percent. Excluding defense, new orders increased 6.2 percent. Transportation equipment, also up four consecutive months, drove the increase, $12.4 billion or 12.1 percent to $115.3 billion.
New Residential Sales – Released 7/26/2023 – Sales of new single‐family houses in June 2023 were at a seasonally adjusted annual rate of 697,000, according to estimates released jointly by the U.S. Census Bureau and the Department of Housing and Urban Development. This is 2.5 percent below the revised May rate of 715,000 but is 23.8 percent above the June 2022 estimate of 563,000. The median sales price of new houses sold in June 2023 was $415,400. The average sales price was $494,700. At the end of June, the seasonally adjusted estimate of new homes for sale was 432,000, a supply of 7.4 months at the current sales rate.
Consumer Confidence – Released 7/25/2023 – Consumer Confidence increased in July to 117.0, up from 110.1 in June. Consumer confidence improved in July to its highest level since July 2021, reflecting improved current conditions and an improvement in expectations.
Existing Home Sales – Released 7/20/2023 – June 2023 brought 4.16 million in sales, a decrease of 3.3% from May. The median sales price was $410,200. The current unsold housing inventory was 3.1 months of inventory.
Housing Starts – Released 7/19/2023 – June housing starts came in at 1,434,000, 8.0% below the May estimate and 8.1% below the June 2022 rate. Building permits were 3.7% below the May rate at $1,440,000 and 15.3% below the June 2022 rate.
Industrial Production and Capacity Utilization – Released 7/18/2023 – Industrial production decreased 0.5% in June for the second consecutive month. Utilities output fell 2.6%. Manufacturing decreased 0.3%. Mining fell 0.2%. Capacity utilization declined to 78.9% in June, 0.8% below the long-run average.
Retail Sales – Released 7/18/2023 – Headline retail sales increased 0.2% in June and are up 1.5% above June 2022.
Producer Price Index – Released 7/13/2023 – The Producer Price Index for final demand increased 0.1 percent in June, seasonally adjusted. Final demand prices declined 0.4 percent in May and increased 0.1 in April. On an unadjusted basis, the index for final demand moved up 0.1 percent for the 12 months ended in June.
Consumer Price Index – Released 7/12/2023 – The Consumer Price Index for All Urban Consumers rose 0.2 percent in June on a seasonally adjusted basis, after increasing 0.1 percent in May. Over the last 12 months, the all-items index increased 3.0 percent before seasonal adjustment.
Consumer Credit – Released 7/10/2023 – Consumer credit increased at a seasonally adjusted annual rate of 1.8 percent in May. Revolving credit increased at an annual rate of 8.2 percent, while nonrevolving credit increased at an annual rate of 0.4 percent.
U.S. Trade Balance – Released 7/6/2023 – The U.S. Census Bureau and the U.S. Bureau of Economic Analysis announced that the goods and services deficit was $69.0 billion in May, down $5.5 billion from $74.4 billion in April. May exports were $247.1 billion, $2.1 billion less than April exports. May imports were $316.1 billion, $7.5 billion less than April imports. The May decrease in the goods and services deficit reflected a decrease in the goods deficit of $4.8 billion to $91.3 billion and an increase in the services surplus of $0.7 billion to $22.3 billion.
Next week we get data on the U.S. Trade Balance, Consumer Credit, CPI, and PPI.
Data Sources:
Bureau of Economic Analysis (BEA)
Congressional Budget Office (CBO)
U.S. Bureau of Labor Statistics (BLS)
Federal Reserve Economic Data (FRED Charts)
CME Fed Watch
U.S. Treasury – Yields
U.S. Census Bureau
Institute for Supply Management (ISM)
Weekly DOL Employment Data
BLS Monthly Jobs Report
JOLTS
US Energy Admin (EIA)
BLS Consumer Price Index CPI
BLS Producer Price Index PPI
Atlanta Fed GDPNOW
NY Fed Nowcast GDP
US Census Bureau Housing Starts
Consumer Credit
USCB Retail Sales
Construction Spending
Federal Reserve Dot Plots
NY Empire Index
Philadelphia Federal Reserve
P/E Ratio Data -Yardeni Research
Technical Analysis Info:
StockCharts.com – Financial Charts
Exponential vs Simple moving average
Koyfin.com
Other Links:
1973 Arab Oil Embargo
Hunt Brothers Silver
Long-Term Capital bailout
Asian Contagion


Table of Contents
Good Life Advisors – Talking Points – Week 31
Fitch Pitches Markets a Curveball…
US equities were lower this week as the S&P 500 was down for the first week in four, while the tech-heavy Nasdaq trailed the broader S&P. Big tech was mostly lower, while semis, tech hardware, medical supplies, airlines, road and rail, parcels and logistics, casinos, cruise lines, hotels, autos, and telecom were some of the other notable underperformers. Some outperformers included networking/IT equipment, machinery energy, paper and packaging, multiline insurance, cable/satellite, apparel, home furnishings, medical distributors, and biotech. Treasuries were mixed with a big curve steepening move. The 2Y/10Y spread narrowed to around -50 bp from -87 bp last week, while the 10Y yield rose earlier this week above 4.10% for the first time in 10 months. The dollar index was down 0.8%, weaker on the major crosses. Gold was up 0.8% for the week. Bitcoin futures were little changed this week. WTI crude was up 2.8% for a sixth-straight weekly gain, all of which were at least 2%.
S&P 500 Sector Performance:
Stocks finished the week lower as the S&P 500 broke a three-week streak of gains. The week’s downside was tabbed to a few factors, including the Fitch US debt downgrade, risk around a higher-for-longer Fed, overbought conditions, stretched sentiment and positioning, disinflation as an earnings headwind, fading normalization tailwinds, some concerns around consumer/discretionary spend, and rising oil and gasoline prices. This week’s big tech earnings (Amazon and Apple) also offered some mixed takeaways, with Apple’s weaker hardware trends in focus. However, recent bullish narratives that remain intact include more soft landing support, peak-Fed and a potential 1H-24 pivot to cuts, more disinflationary traction, positive macro surprise momentum, strong household balance sheets.
This week also saw a big yield curve steepening move with the 10Y yield up over 15 bp, pushing beyond 4.10% for the first time since November, though the short end of the curve rallied amid the latest round of positive macro surprise momentum. The 30Y was also up nearly 20 bp w/w, some of which was tabbed to this week’s Treasury refunding announcement, which will increase 2Y, 5Y, and 10Y auction sizes. Treasury also said that further increases will be likely in future quarters. This week’s Fitch downgrade of US debt also played into the backup on the long end of the curve, signaling risk of growing deficits and rising interest costs further out into the future. Other factors also played into the week’s backup in yields included positioning and technical factors, the Fed’s commitment to QT, and the BoJ’s YCC policy tweak.
However, this week saw more support for the soft landing and peak-Fed narratives. Friday’s July payrolls report signaled more slowing in the pace of job growth. The July print missed consensus for a second-straight month with the lowest print since the Dec-20 contraction, while the prior two months were revised lower. Average hourly wages came in hotter, though that was offset by lower hours worked. Bank of America and JPMorgan economists also revised their outlook for no recession, citing factors including strong economy activity over recent quarters, a low unemployment rate combined with softening wage and price pressures, and stabilization in cyclical sectors. The market median year-end fed funds rate of 4.39% was little changed this week, though the market is now pricing in a rate cut in Mar-24, up from May-24 last week.
With 84% of S&P 500 companies having now reporting Q2 earnings, 79% of those companies have reported EPS above estimates, better than the five-year average of 77%. The actual y/y earnings decline also improved to -5.2% from -7.4% last week, though still on pace for the largest annualized earnings decline since Q2-20 (-5.7%).
Fixed Income
Yield Curve
May FOMC Statement March Fed Minutes Balance Sheet Reduction Plan Credit, Liquidity and Balance Sheet Federal Reserve Dot Plots
Treasury.gov yields FOMC Policy Normalization Statement Longer- Run Goals Jan 2022
Foreign Exchange Market
Energy Complex
The Baker Hughes rig count was down 5 this week. There are 659 oil and gas rigs operating in the US – Down 105 from last year.
Metals Complex
Employment Picture
July Jobs Report – BLS Summary – Released 8/4/2023 – The US Economy added 187k nonfarm jobs in July and the Unemployment rate was little changed at 3.5%. Average hourly earnings increased 14 cents to $33.74. Hiring highlights include +100k Education and Health Services.
Weekly Unemployment Claims – Released Thursday 8/3/2023 – In the week ending July 29, the advance figure for seasonally adjusted initial claims was 227,000 increasing 6,000 from the previous week’s revised level. The 4-week moving average was 228,250 a decrease of 5,500 from the previous week’s revised average.
Job Openings & Labor Turnover Survey JOLTS – Released 8/1/2023 – The number of job openings decreased to 9.6 million on the last business day of June, the U.S. Bureau of Labor Statistics reported. Over the month the number of hires and total separations decreased to 5.9 million and 5.6 million, respectively. Within separations, quits (3.8 million) increased and discharges (1.5 million) changed little.
Employment Cost Index – Released 7/28/2023 – Compensation costs for civilian workers increased 1.0% for the 3-month period ending in June 2023. The 12-month period ending in June 2023 saw compensation costs increase by 4.5. The 12-month period ending June 2022 increased 5.1%. Wages and salaries increased 4.6 percent over the 12-month June 2023 and increased 5.3 percent for the 12-month period ending in June 2022. Benefit costs increased 4.2 percent over the 12-month period ending June 2023 and increased 4.8 percent for the 12-month period ending in June 2022. This report is published quarterly.
This Week’s Economic Data
Links take you to the data source
PMI Non-Manufacturing Index – Released 8/3/2023 – Economic activity in the services sector expanded in July for the seventh consecutive month as the Services PMI® registered 52.7 percent, 1.2 percentage point lower than June’s reading of 53.9 percent.
U.S. Construction Spending – Released 8/1/2023 – Construction spending during June 2023 was estimated at a seasonally adjusted annual rate of $1,938.4 billion, 0.5 percent above the revised May estimate of $1,929.6 billion. The June figure is 3.5 percent above the June 2022 estimate of $1,873.2 billion.
PMI Manufacturing Index – Released 8/1/2023 – The July Manufacturing PMI registered 46.4 percent, 0.4 percentage points higher than the 46.0 percent recorded in June. Regarding the overall economy, this figure indicates an eighth month of contraction after a 30-month period of expansion. The New Orders Index remained in contraction territory at 47.3 percent, 1.7 percentage points higher than the figure of 45.6 percent recorded in June. The Production Index reading of 48.3 percent is a 1.6-percentage point increase compared to June’s figure of 46.7 percent.
Chicago PMI – Released 7/31/2023 – Chicago PMI remained in contraction territory in July increasing to 42.8 points up from 41.5 points in June. This marks eleven months in contractionary territory.
Recent Economic Data
Links take you to the data source
US Light Vehicle Sales – Released 7/28/2023 – U.S. light vehicle sales were at a seasonally adjusted annual rate (SAAR) of 15.657 million units in June.
Personal Income – Released 7/28/2023 – Personal income increased $69.5 billion (0.3 percent at a monthly rate) in June. Disposable personal income (DPI) increased $67.5 billion (0.3 percent). Personal consumption expenditures (PCE) increased $100.4 billion (0.5 percent).
Advance Estimate of 2nd Quarter 2023 GDP – Released 7/27/2023 – Real gross domestic product (GDP) increased at an annual rate of 2.4 percent in the second quarter of 2023, according to the “advance” estimate released by the Bureau of Economic Analysis. In the first quarter, real GDP increased 2.0 percent. The GDP estimate released today is based on source data that are incomplete or subject to further revision. The increase in real GDP reflected increases in consumer spending, nonresidential fixed investment, state and local government spending, private inventory investment, and federal government spending that were partly offset by decreases in exports and residential fixed investment. Imports, which are a subtraction in the calculation of GDP, decreased.
Durable Goods – Released 7/27/2023 – New orders for manufactured durable goods in June, up four consecutive months, increased $13.6 billion or 4.7 percent to $302.5 billion, the U.S. Census Bureau announced today. This followed a 2.0 percent May increase. Excluding transportation, new orders increased 0.6 percent. Excluding defense, new orders increased 6.2 percent. Transportation equipment, also up four consecutive months, drove the increase, $12.4 billion or 12.1 percent to $115.3 billion.
New Residential Sales – Released 7/26/2023 – Sales of new single‐family houses in June 2023 were at a seasonally adjusted annual rate of 697,000, according to estimates released jointly by the U.S. Census Bureau and the Department of Housing and Urban Development. This is 2.5 percent below the revised May rate of 715,000 but is 23.8 percent above the June 2022 estimate of 563,000. The median sales price of new houses sold in June 2023 was $415,400. The average sales price was $494,700. At the end of June, the seasonally adjusted estimate of new homes for sale was 432,000, a supply of 7.4 months at the current sales rate.
Consumer Confidence – Released 7/25/2023 – Consumer Confidence increased in July to 117.0, up from 110.1 in June. Consumer confidence improved in July to its highest level since July 2021, reflecting improved current conditions and an improvement in expectations.
Existing Home Sales – Released 7/20/2023 – June 2023 brought 4.16 million in sales, a decrease of 3.3% from May. The median sales price was $410,200. The current unsold housing inventory was 3.1 months of inventory.
Housing Starts – Released 7/19/2023 – June housing starts came in at 1,434,000, 8.0% below the May estimate and 8.1% below the June 2022 rate. Building permits were 3.7% below the May rate at $1,440,000 and 15.3% below the June 2022 rate.
Industrial Production and Capacity Utilization – Released 7/18/2023 – Industrial production decreased 0.5% in June for the second consecutive month. Utilities output fell 2.6%. Manufacturing decreased 0.3%. Mining fell 0.2%. Capacity utilization declined to 78.9% in June, 0.8% below the long-run average.
Retail Sales – Released 7/18/2023 – Headline retail sales increased 0.2% in June and are up 1.5% above June 2022.
Producer Price Index – Released 7/13/2023 – The Producer Price Index for final demand increased 0.1 percent in June, seasonally adjusted. Final demand prices declined 0.4 percent in May and increased 0.1 in April. On an unadjusted basis, the index for final demand moved up 0.1 percent for the 12 months ended in June.
Consumer Price Index – Released 7/12/2023 – The Consumer Price Index for All Urban Consumers rose 0.2 percent in June on a seasonally adjusted basis, after increasing 0.1 percent in May. Over the last 12 months, the all-items index increased 3.0 percent before seasonal adjustment.
Consumer Credit – Released 7/10/2023 – Consumer credit increased at a seasonally adjusted annual rate of 1.8 percent in May. Revolving credit increased at an annual rate of 8.2 percent, while nonrevolving credit increased at an annual rate of 0.4 percent.
U.S. Trade Balance – Released 7/6/2023 – The U.S. Census Bureau and the U.S. Bureau of Economic Analysis announced that the goods and services deficit was $69.0 billion in May, down $5.5 billion from $74.4 billion in April. May exports were $247.1 billion, $2.1 billion less than April exports. May imports were $316.1 billion, $7.5 billion less than April imports. The May decrease in the goods and services deficit reflected a decrease in the goods deficit of $4.8 billion to $91.3 billion and an increase in the services surplus of $0.7 billion to $22.3 billion.
Next week we get data on the U.S. Trade Balance, Consumer Credit, CPI, and PPI.
Data Sources:
Bureau of Economic Analysis (BEA)
Congressional Budget Office (CBO)
U.S. Bureau of Labor Statistics (BLS)
Federal Reserve Economic Data (FRED Charts)
CME Fed Watch
U.S. Treasury – Yields
U.S. Census Bureau
Institute for Supply Management (ISM)
Weekly DOL Employment Data
BLS Monthly Jobs Report
JOLTS
US Energy Admin (EIA)
BLS Consumer Price Index CPI
BLS Producer Price Index PPI
Atlanta Fed GDPNOW
NY Fed Nowcast GDP
US Census Bureau Housing Starts
Consumer Credit
USCB Retail Sales
Construction Spending
Federal Reserve Dot Plots
NY Empire Index
Philadelphia Federal Reserve
P/E Ratio Data -Yardeni Research
Technical Analysis Info:
StockCharts.com – Financial Charts
Exponential vs Simple moving average
Koyfin.com
Other Links:
1973 Arab Oil Embargo
Hunt Brothers Silver
Long-Term Capital bailout
Asian Contagion
Categories:
Tags: